What's new

December's Bible Build: Linked Suspensions

I'm in the middle of my current build which is leafs front and rear, Ive been contemplating linking the rear (triangulated) based on ease and available space. I know a lot of the conversations are centered around rigs linked front and rear. Is there any differences in design numbers that should be accounted for when only doing the rear vice both or just the front?

keeping leaves on one end helps "hold" everything together. if I had to pick just front or just rear, i'd choose to link the front first. Why? more weight up front and more room to move when going uphill.

that's just me, there are 100x more people who do the rear only and are happy. leaves let you get away with a little bit more but the numbers for one end should still generally be the same regardless of the other end.
 
Shock Placement

What I do know is that there is very small difference between mounting the shock at a 45* angle on the axle and vertically on the link.

This is only true for the exact instant through the travel that the shock is angled at 45 degrees. As it compresses more, the angle will get closer to zero (unless you have some way of mounting the shock to the axle where it starts at 45 and approaches 90 as it compresses, but I can't picture it), which is bad. You want the spring rate to increase as you get closer to bottoming out the suspension.

On the flip side, when mounting shocks on a link, you want to set the shock perpendicular to the link at full compression. This means that at ride height, it will be angled forward some, or maybe even a lot.
 
Also, you guys are overthinking the portal thing...
or maybe I'm just under thinking it, lol. As I see it, there are only a few variables to consider:
  1. The driveshaft trying to rotate and the ring gear resisting. Equal and opposite reaction of driveshaft twist trying to make the chassis lean. This would be the same for 2 gear and 4 gear portals as well as non portal solid axles assuming the driveshaft rotates the same direction and the final drive ratio is the same.
  2. The tires trying to rotate and the ground/traction resisting. Equal and opposite reaction around the wheel center line through the links, pushing and pulling on the chassis. Again, same for 2 gear and 4 gear portals as well as non portal solid axles assuming the final drive ratio is the same.
  3. Braking: see #2
 
This is only true for the exact instant through the travel that the shock is angled at 45 degrees. As it compresses more, the angle will get closer to zero (unless you have some way of mounting the shock to the axle where it starts at 45 and approaches 90 as it compresses, but I can't picture it), which is bad. You want the spring rate to increase as you get closer to bottoming out the suspension.

On the flip side, when mounting shocks on a link, you want to set the shock perpendicular to the link at full compression. This means that at ride height, it will be angled forward some, or maybe even a lot.

It is poorly worded, but what I was trying to say is that the effective install ratio does not care if the shock is mounted to the axle or a link. This is more aimed at something like a 4500 car that can't use the links for a mechanical advantage on the shocks, but where the rules state that angling the shock does not count as a mechanical advantage. With some design time taken, you can get similar install ratio curves between link and axle mounting.

The only way I can picture a setup that returns to vertical and starts at 45* is with short arms and a lot of travel moving the axle torawrds the center of the car a ton. But that obviously has major disadvantages and shouldn't be done.

That said, in regards to axle mounted, I'm not sure that vertical when compressed is the correct answer. On the surface it seems to be because it then puts the force vertical. But, I can't help but wonder if it's better to mount it such that it's perpendicular to a line running from the mount to the IC. This would put the force perpendicular to the direction of travel of the axle at max compression.
 
Also, you guys are overthinking the portal thing...
or maybe I'm just under thinking it, lol. As I see it, there are only a few variables to consider:
  1. The driveshaft trying to rotate and the ring gear resisting. Equal and opposite reaction of driveshaft twist trying to make the chassis lean. This would be the same for 2 gear and 4 gear portals as well as non portal solid axles assuming the driveshaft rotates the same direction and the final drive ratio is the same.
  2. The tires trying to rotate and the ground/traction resisting. Equal and opposite reaction around the wheel center line through the links, pushing and pulling on the chassis. Again, same for 2 gear and 4 gear portals as well as non portal solid axles assuming the final drive ratio is the same.
  3. Braking: see #2

1and 2: I agreed with what you are saying, but doing a little more digging into the torque reaction of the portals, or any geared hub for that matter, has me changing my mind. In ThinAir's thread on portal ifs anti values he put two equations on page 16 or so that describe the reaction torque on the axle from the reduction. When he ran through the numbers using the separated torque and thrust forces, the anti squat changed from 60% to 150%. Or it might have been -150%, I can't remember off the top of my head. I've been meaning to work through the equations behind it to make a calculator, but haven't gotten around to it.

3: Outboard brakes are outboard brakes and don't change the forces.
 
Bumping this back up, currently have a 3 link in my Tacoma that works well but I am going back in to add a truss and clean up some of the janky shit I did 7 years ago which may involve removing the upper link mount from the diff and making a new mount incorporated into the truss I'm adding. All other things being equal, what will change if I make the upper link 3-4" longer? If I do, it will be closer to the length of the lowers (but not the same). I'm guessing anti-dive will increase and pinion change throughout travel will increase but I'm just speculating wildly haha
 
Bumping this back up, currently have a 3 link in my Tacoma that works well but I am going back in to add a truss and clean up some of the janky shit I did 7 years ago which may involve removing the upper link mount from the diff and making a new mount incorporated into the truss I'm adding. All other things being equal, what will change if I make the upper link 3-4" longer? If I do, it will be closer to the length of the lowers (but not the same). I'm guessing anti-dive will increase and pinion change throughout travel will increase but I'm just speculating wildly haha
Short answer: It depends, but most stuff, especially values throughout travel, will change.

Long answer: If at ride height the 2 points that define the ends of the old link fall on the infinite line defined by the two end points of the new link the values will not change at ride height. But the suspension will not move in the same way. As it travels up and down as well as articulates all the measured values like roll slope, antis, pinion angle and flex steer will be different.
 
Because I typed it out for another thread, figured it should be copied here.

How to set up a CAD model for checking articulation clearance and travel clearance. Also to find max articulation angle as well as flex steer.

Just a note, this is not how the data gathering was done. I personally prefer to work with mostly wire frame sketches and some 3d bodies which tends to be more accurate and allows me to have multiple persistent points of travel at the same time. Its also less time consuming and allows me to do cycle without having the shocks as part of the picture at all if needed.


The easiest way to allow you to cycle the suspension digitally is as follows; its not the most convenient or accurate way and it will only show one point at a time, but it is the easiest. This is a general guide. Not all CAD software will use the same names or procedures for the functions.

The panhard is considered to be a link. This does not work for over constrained suspensions such as 4 link with panhard and radius arms.

  1. Links: Model the link as a solid circular bar running from one point to the other. The diameter should be the OD of the tube you plan to use for this link
  2. Extend each end of the link by 1/2 the diameter from step 1
  3. Fillet the edge by the same amount as it was extended in step 2. This should result in a hemisphere end
  4. Repeat for all links.
  5. Shocks: Create a cylinder that is is 1/2 the height of its diameter.
  6. Fillet the edges of this cylinder so that it also forms a hemisphere.
  7. As a new part, create a cylinder that is the same diameter as the max diameter of your shock or coilover. The length is the maximum extended length of the shock.
  8. Rear Axle: Create a box with the side lengths matching the diameter of your axle tube. The length of this box is 1/2 the distance between your tires
  9. Add a cylinders to the end of the cylinder from step 8 that are the same size as your tires.
  10. Front axle: Create a box with the side lengths matching the diameter of your axle tube. The length of this box is 1/2 the distance between the points formed by the intersection of the line between the ball joints or kingpins and the axle centerline.
  11. Create a cylinder at an angle going out the distance from the pivot point to the outside of the tire. The angle is the same amount as the steering angle. For more accuracy match the caster and king pin angle as well.
  12. Extend this cylinder back towards the pivot such that it has the same width as the wheel.
  13. Both axles: Mirror using the flat part of the axle tube. This should result in a dumbbell shape for the rear and a bent dumbbell in the front.
  14. Create a cylinder going from the box to the suspension mounting point. The diameter of the cylinder does not matter.
  15. Extend the cylinder by its radius and fillet to create a hemisphere end
  16. Repeat for all link and shock mounting points on axles
  17. Frame: Create spheres at all links and shock points. Ground these spheres in place
  18. Mates: * All following mates are concentric/ball mates unless noted. Different CAD programs may do this portion differently. * Mate the round link ends from steps 1-4 to the frame spheres from step 17
  19. Mate the other ball end of the link to the corresponding hemisphere on the axle
  20. Repeat for all links, it may help to drag the link to its rough orientation before performing the second mate
  21. Mate the hemisphere from step 9 to the axle shock hemisphere.
  22. Mate a second hemisphere from step 9 to the frame shock ball
  23. Mate the end of the cylinder from step 7 to the frame side hemisphere
  24. Mate the flat sides of the hemispheres from steps 22 and 23. Set the mate offset to the shock length at ride Take note of where the value for offsetting the matting surfaces is. This is how you will cycle the suspension.
To Cycle: change the value noted in step 24. Set it to the length of the shock you want to check at. To get full articulation set one side to max shock length and one to minimum. For bump set both to minimum. For droop both to max.
 
Or you can just waste days of your life searching the internet and modeling the parts you need to set it up how it will be in real life. :flipoff2:

Buggy Flex.jpg


But no that is a great way to set it up quickly to see how everything cycles. Before I added all of the joints to the model I just had a master 3D sketch of the front and rear suspension, with 2 cases drawn for each link (full bump and full droop), while I figured out all of my base point geometry. Then just mated the sketch lines and points of the link cylinders, shock cylinders and axles to the sketch points of my 3D master sketch of the suspension. That way it was all point to point mates and everything could pivot and move how it should.

Buggy Chassis.jpg
 
Taking a break from portals for a bit. The newest version of the 4 link calc allows me to bring up the subject of what happens when the you allow the body to move while calculating geometry values like antis and roll centers/axis. It goes without saying that exactly what happens depends on the geometry. Of note, it seems that anti values climb to more extreme values than they do with the body held steady. An example of max rear compression and max front droop. Solid lines are the pitched links, dashed are the ride level links. Interestingly enough, with 8 inches rear bump travel and 8.5 inches of droop in the front, the vehicle only pitches 9.1 degrees. However the sprung mass CG raises an inch.

Pitch view.png


Looking at what else happens when the body can move from flat and level, namely going up or down. My understanding is that the frame of reference is held parallel to the current ground plane, or in other words, rotates with the ground. Therefore the method of calculating the geometry stays the same. But what does change is the load on the springs. For the case of going up the front droops out, but depending on the conditions, the rear can travel in bump or droop.

Sorry to bring this back up but I have a question about this section of the calculator. Is the change in antis while going up an incline directly related to the change in suspension travel and F/R drive bias? I have always wondered about this and couldnt wrap my head around whether the change in angle between force of gravity and the chassis/suspension had an effect on the antis. But now after seeing this new section of the calculator it seems like the combination of change in drive bias/weight distribution and change in travel (chassis rotation) is a result of the change in angle of gravity relative to the chassis, which effects the antis. Is this correct?
 
Or you can just waste days of your life searching the internet and modeling the parts you need to set it up how it will be in real life. :flipoff2:

Buggy Flex.jpg


But no that is a great way to set it up quickly to see how everything cycles. Before I added all of the joints to the model I just had a master 3D sketch of the front and rear suspension, with 2 cases drawn for each link (full bump and full droop), while I figured out all of my base point geometry. Then just mated the sketch lines and points of the link cylinders, shock cylinders and axles to the sketch points of my 3D master sketch of the suspension. That way it was all point to point mates and everything could pivot and move how it should.

Buggy Chassis.jpg
That's how I used to do it. But I kept getting annoyed trying to keep the sketch from moving. But that was probably because I was figuring out a new CAD software that handles some of that stuff differently than solidworks and the other industry ones do.

Complete mock up of all points of points of interest. Little easier when you are designing around airshocks.

1619727506955.png


Unrelated, where did you get the model/dimensions for the fabricated housing? I haven't been able to find the dimensions for any of them.
 
Sorry to bring this back up but I have a question about this section of the calculator. Is the change in antis while going up an incline directly related to the change in suspension travel and F/R drive bias? I have always wondered about this and couldnt wrap my head around whether the change in angle between force of gravity and the chassis/suspension had an effect on the antis. But now after seeing this new section of the calculator it seems like the combination of change in drive bias/weight distribution and change in travel (chassis rotation) is a result of the change in angle of gravity relative to the chassis, which effects the antis. Is this correct?
When I wrote that portion of the calculator, I looked for everything I could regarding the effect of an inclined ground surface. The most thorough look into it that i could find was on PBB, and it came down to forces parallel to the ground surface are not considered in looking at antisquat.. Or put a better way, you rotate the ground and vehicle image such that the incline is flat and then look at the geometry. So the weight transfer to the rear from going up an incline appears, but the incline itself does not.

Part of the confusion seems to be the weight distribution. Weight distribution does not affect the antis.

The way gravity affects it is it increases the load on one end and lightens the other end. This causes one end to compress (up travel) and the other to extend (down travel). It also increases the drive bias towards the loaded side

The calculator does not account for the change in drive bias. I believe I could probably have it do so, but to do so with any sort of accuracy would require looking at the vehicle dynamically, which would be cool, but I have no interest in doing it in Excel.
The housing is something I modeled myself. I have a model that is supposedly a spidertrax housing that I found in a Facebook CAD file Group but not sure how accurate it is. I’ve always wanted to build my own housings so I just drew up my own instead of spending $800 on a spidertrax.

As for the incline effects on antis. That’s what I gathered after messing around with this part of the calculator. I’m assuming you mean this part of the calculator doesn’t account for change in drive bias due to incline and acceleration? I know you have the front drive bias on the first page but I assumed this has no effect on the values on the inclIne page. I thought it was interesting that earlier versions of the calculator were based on 100% rear drive bias. I did not realize that.

But yes that would be a pretty complicated dynamic analysis to do in an excel spread sheet in order to incorporate suspension travel and drive bias based on incline and acceleration into the all of the calculations. Thank you for clearing things up for me.
The plot portions only look at the geometry at the travel values given or inputted using the drive bias from the Link Calculator page. The prediction portion predicts the travel at both ends for the inputted acceleration, a inputted slope and the +/- of the acceleration from the Link Calculator page.

The 100% rear bias probably stems from Triaged involvement with the desert racing world.

Now that I think about it more, if we assume that drive bias is equal to the % of weight on that end of the vehicle, it might be pretty easy to predict. We have the static weight split. And load transfer is pretty easy to determine. The sum of those is the weight on that end.
 
The housing is something I modeled myself. I have a model that is supposedly a spidertrax housing that I found in a Facebook CAD file Group but not sure how accurate it is. I’ve always wanted to build my own housings so I just drew up my own instead of spending $800 on a spidertrax.

As for the incline effects on antis. That’s what I gathered after messing around with this part of the calculator. I’m assuming you mean this part of the calculator doesn’t account for change in drive bias due to incline and acceleration? I know you have the front drive bias on the first page but I assumed this has no effect on the values on the inclIne page. I thought it was interesting that earlier versions of the calculator were based on 100% rear drive bias. I did not realize that.

But yes that would be a pretty complicated dynamic analysis to do in an excel spread sheet in order to incorporate suspension travel and drive bias based on incline and acceleration into the all of the calculations. Thank you for clearing things up for me.
Just changed/added a bunch of stuff to the pitch page. Basically all of the stuff we just discussed. Should be more options to play around with now.
 
The plot portions only look at the geometry at the travel values given or inputted using the drive bias from the Link Calculator page. The prediction portion predicts the travel at both ends for the inputted acceleration, a inputted slope and the +/- of the acceleration from the Link Calculator page.

The 100% rear bias probably stems from Triaged involvement with the desert racing world.

Now that I think about it more, if we assume that drive bias is equal to the % of weight on that end of the vehicle, it might be pretty easy to predict. We have the static weight split. And load transfer is pretty easy to determine. The sum of those is the weight on that end.
Yeah after I thought about what you said could be assumed about the drive bias relative to the weight transfer it seems like you had most of the info there just needed to combine so it all went along with the incline and acceleration.

Also something I forgot to mention, I am getting this in the predictions section after I entered my suspension values. The predictions were there when I first opened the calculator but after putting my link values in this is what it shows. I just opened the 6.3 version and this is shown with your values as well. Not sure if this is the appropriate thread to put this in but just thought I would mention it while we were on the topic. I can move it to the show my numbers thread if you would like me to.

1619787825096.png
I'll look into it. Can we move this over to the 4 link calculator thread?
 
Hey Guys,

apologies if this has been covered, and I am still playing catch up to the latest in definitions/understandings. Until a month ago Ive been doing my calcs with graph paper and compass. :shaking:

My front 3 Link is set up with 100% AS at ride height, slightly longer top vs bottom link.

My question is about my confusion on AD when considering Anti Lift properties on an incline. If i understand correctly, the weight bias on incline does not change the AD/AL , but on an incline, the weight bias DOES allow my coilovers to extend a bit, which is making my AD go way up past 100%

My IC is at 100% almost directly over my rear axle center line IIRC

How this feels in my truck is the as the AD % increases with coilover extension, the 'Lift" from adding torque to the front axle in that state removes my springs ability to absorb even more so.

If that is all correct than im thinking of raising my axle side upper link mount to bring my AD % down to help with that situation.

Currently thats the only easy adustment i can make to my upper mount to decrease AD %

My panhard and drag link are about perfectly horzontal at ride height as well. I havent had the oppurtunity to plug it in to the calc yet, as soon as I do, it will be a lot easier to show my numbers and get better feedback.
 
also... so the newest version 4 link is what i should use for my 3 link as well? Anything worthy to note when using it to calc 3 link?
 
Hey Guys,

apologies if this has been covered, and I am still playing catch up to the latest in definitions/understandings. Until a month ago Ive been doing my calcs with graph paper and compass. :shaking:

My front 3 Link is set up with 100% AS at ride height, slightly longer top vs bottom link.

My question is about my confusion on AD when considering Anti Lift properties on an incline. If i understand correctly, the weight bias on incline does not change the AD/AL , but on an incline, the weight bias DOES allow my coilovers to extend a bit, which is making my AD go way up past 100%
It does not change how it is calculated. The shifting of load from the front to the rear changes the geometry. This changes how it reacts.. It is very possible that the AD stays the same or decreases when climbing.

As the loading moves to the rear, it's share of the forward force increases. This moves the vertical line at which AL/AD are measured at forward. This reduces the AD/increases the AL. If the decrease in AD from this is more than the increase caused by slope of the line from the tire contact to the IC, it will be a net decrease.
My IC is at 100% almost directly over my rear axle center line IIRC
This will put the AD closer to 50 in 4wd on flat ground.
How this feels in my truck is the as the AD % increases with coilover extension, the 'Lift" from adding torque to the front axle in that state removes my springs ability to absorb even more so.
It may be an issue originating in the rear. Since you have leafs, are you using a traction bar or anything else to reduce wrap?
If that is all correct than im thinking of raising my axle side upper link mount to bring my AD % down to help with that situation.

Currently thats the only easy adustment i can make to my upper mount to decrease AD %
That is probably the opposite direction to where you should go. Lowering the upper at the axle will push the IC further rearward, lowering AD.
My panhard and drag link are about perfectly horzontal at ride height as well. I havent had the oppurtunity to plug it in to the calc yet, as soon as I do, it will be a lot easier to show my numbers and get better feedback.
The calc is only as accurate as the numbers you put in. Put the correct values in for rear travel, make the links sufficiently long (40"+) and check the "Vehicle Pitch" page. Should give you an idea of what the front is doing when it is pitched. Spring rates don't affect pitch calcs, just pitch predictions.

also... so the newest version 4 link is what i should use for my 3 link as well? Anything worthy to note when using it to calc 3 link?
Yes. For 3 links, it is only close not precise. It doesn't account for the effect of the movement of the axle end of the panhard on the axle's position. For a long panhard with reasonable travel, theses effects are small enough that the can be ignored.
 
It does not change how it is calculated. The shifting of load from the front to the rear changes the geometry. This changes how it reacts.. It is very possible that the AD stays the same or decreases when climbing.

As the loading moves to the rear, it's share of the forward force increases. This moves the vertical line at which AL/AD are measured at forward. This reduces the AD/increases the AL. If the decrease in AD from this is more than the increase caused by slope of the line from the tire contact to the IC, it will be a net decrease.

This will put the AD closer to 50 in 4wd on flat ground.

It may be an issue originating in the rear. Since you have leafs, are you using a traction bar or anything else to reduce wrap?

That is probably the opposite direction to where you should go. Lowering the upper at the axle will push the IC further rearward, lowering AD.

The calc is only as accurate as the numbers you put in. Put the correct values in for rear travel, make the links sufficiently long (40"+) and check the "Vehicle Pitch" page. Should give you an idea of what the front is doing when it is pitched. Spring rates don't affect pitch calcs, just pitch predictions.


Yes. For 3 links, it is only close not precise. It doesn't account for the effect of the movement of the axle end of the panhard on the axle's position. For a long panhard with reasonable travel, theses effects are small enough that the can be ignored.
treefrog thank you for your reply.

I do have an antiwrap bar on my rear axle, mounted to a shackle/heim setup on the crossmember.

your explanation helped me see that I had it backwards in my brain.

When I get my truck in the shop and weighed in correctly Ill input my data and post it up to see what you guys see that I may not.

Priceless info thanks again for your time.
A quick question regarding the antiwrap bar. The 2 lines formed by the axle points and the other end of the bar. Take the one that has the greater perpendicular distance to the centerline of the axle. Does that line point above or below where you would estimate the sprung CG to be?

1634606428420.png
I will confirm tomorrow, but I am pretty certain it points below. The frame side of the bar attaches to a shackle via heim. That shackle is near vertical, so would that line be drawn from most offset axle attachment > top of shackle mount on x member or straight with the heim (bottom of shackle) ?

Thank you again for your time.
The heim. Forgot to ask, is it the upper line or the lower line?

Edit: Seems I need to do more reading on anti wrap bars. From rcurrier44 on PBB:
attachment.png

The flat line is horizontal, through the centerline of the wheel. If possible, get the link locations in the calculator just to see what the IC's do. The AL/AD values will be off but the ICs will provide insight.

For the rear, use the anti wrap shackle points as the upper. For the lower, use the wheel center and a point at the wheel center height a very long ways ahead of the vehicle, a 1000"+ should do.
 
Last edited:
Since I made the plots for axle steering during articulation, something has been bothering me. The data was good at showing that doing X has Y effect, but it did a poor job of isolating variables, in particular the total disregard for roll slopes and roll centers. Part of this comes from thinking about what defines the position of a pair of links. So, in theory, a pair of links, is constrained by a line through the frame points, a line through the axle points and the point where the links converge. Not the best picture, but hopefully enough to get the idea across.

Lines and points.JPG

Any pair of links that starts at one line, ends at the other, and goes through that point will have the exact same geometry in all of the plots in the 4-Link Calculator. The only difference between pairs of links is the angle of convergence. And I believe that this holds true even if the links aren't symmetric to the vehicle's centerline.

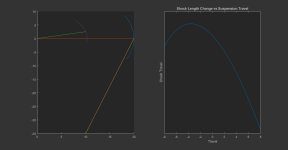
So if they are the same from a 2d geometry standpoint, that only leaves 3d for differences. So here's that data:
Constant Geometry Plot.png


Again, actual numbers don't matter. The precision I'm measuring with is .1 degree. The 4 test setups were full spacing between all links, 1/2 the spacing on the lower links, 1/2 the spacing on the upper links, and 1/2 spacing on both pairs of links. The plots where the uppers have been brought to 1/2 spacing are the same; the full spacing on uppers are the same. It seems that the lower spacing did not change the results.

The actual numbers used for the test suspension were fairly generic, 40 inches long side view, 10 in spacing on the axle. Flat lowers, uppers that slant down towards the frame. Same points used for travel for all for tests.

The conclusion on all this is find geometry you like, apply a scaling factor to the Y values for the pair of links (same factor to both ends of the link, does not need to be the same value for upper and lower) to get the angle of converge and clearances you want.

Now that said, this does bring up something else to look into. Non symmetric setups. In theory different offsets of non-flat links to be used to counteract torque roll, similar to how a panhard can be used for the same in a 3-link. Only question is what that will do to articulation steering.
 
In the last post I mentioned asymmetric setups, since then ran the numbers on it. This used the same model as the previous post. All of the anti values, roll slopes, roll centers, pinion change, etc. are the same through 2d travel. It used the full spacing model, but one of the upper links, in this case the driver side assuming rear suspension, was moved in to the half spacing location. Looks kinda odd.
Asymmetric model.JPG


Predictably, the axle steer changed depending on which side was moved. So first for the surface plot throughout travel on both sides. Doesn't really show much.

Non-Symetric.png

More intresting is the plot that shows the difference between XY and YX travel.
Non-Symetric difference.png

We can ignore the back side of the plot since the way I processed the data created a mirror image, and I didn't feel like taking the time to trim that off. Once again the results are predictable, at the more extreme ends of travel the difference between XY and YX articulation are greater. .3 degrees might not seem like a big difference, but it is almost a 20% difference. Then again at such a small magnitude and with large aired down tires, it not be noticeable.

One last plot for this, showing the the difference between the sides when holding one at full bump while moving the other. Include is the same plot for symmetric full spacing.
Non-symmetic full bump.png

Interesting that the wider side moving has less steering effect than the symmetric version while the narrow side moving has more.
 
Some images and talk of cantilevered springs got brought up in the Sway Bar Tech thread. I created a quick calculator to look at shock travel of the suspension style in question. Hoping to reduce side tracking of that thread and since I feel that IR and travel stuff is more suspension design than sway bar tech I am posting it here.

Tagging members who may be interested: AgitatedPancake posford

Limitations:
I am not tuning to use the full range of travel of the shock​
The axle point is being modeled as pure vertical travel, no horizontal movement​
It is being modeled as the shock and connecting link are at the same point on the axle​
It seems that with a 4 link and making use of horizontal movement and pinion change, you could get some very tuned IR curves.

As a side note, while I may make a math model that adds this to a linked suspension, I have no plans to add cantilevered setups to the 4 link calculator. There are just too many possible configurations.
What the plots display: The left plot shows the arcs of travel as well as the levers and connecting link at ride. The right plot shows the relative change in length for a 0.01" change in travel.

First up, my best guess on the locations used. Values will be off, but trends should hold. As such, I removed the numbers showing shock travel.

As designed.jpg


The next few show what may be the real advantage to this sort of system, its ability to create diverse and interesting shock travel vs wheel travel curves. It should be noted that the shock travel autoscales and may look like a much larger change than it actually is.
1.jpg

2.jpg

3.jpg

4.jpg

5.jpg

6.jpg

It seems to be a 3rd order polynomial. I may look into curve fitting and seeing what the constants are.
edit: It is not a third order polynomial.
 

Attachments

  • 6.jpg
    6.jpg
    39 KB · Views: 6
Last edited:
This is awesome to see, and thanks for the tag Treefrog. The arm configuration in that thread is pretty dang interesting. It's super interesting to see how drastically the nature of the motion ratio changes with not-so-extreme configuration changes.

A couple questions just to help reinforce my understanding of what you have graphed here

-With the shock travel autoscaling in these examples while axle travel stays consistent, do we have any way to actually observe what kind of motion ratio the right hand graphs represent? I get that we can see the overall linear/progressive/digressive nature which is excellent on its own, but it would also be sweet to have a quick reference sense of scale just to get a feel for how drastically that motion ratio is actually changing through travel

-On a couple of the left charts, the arcs showing the full travel range don't seem to pivot around the chosen pivot points (the line segments representing the arm lengths aren't perpendicular to the arcs at their point of contact), is that just a visual glitch or is that something actually in the geometry?
 
This is awesome to see, and thanks for the tag Treefrog. The arm configuration in that thread is pretty dang interesting. It's super interesting to see how drastically the nature of the motion ratio changes with not-so-extreme configuration changes.

A couple questions just to help reinforce my understanding of what you have graphed here

-With the shock travel autoscaling in these examples while axle travel stays consistent, do we have any way to actually observe what kind of motion ratio the right hand graphs represent? I get that we can see the overall linear/progressive/digressive nature which is excellent on its own, but it would also be sweet to have a quick reference sense of scale just to get a feel for how drastically that motion ratio is actually changing through travel
I'll post up some plots showing shock travel/suspension travel with numbers a bit later tonight. I was mostly asleep and more interested in showing the natures last night. I'll also post a force plot from one I tuned a little.
-On a couple of the left charts, the arcs showing the full travel range don't seem to pivot around the chosen pivot points (the line segments representing the arm lengths aren't perpendicular to the arcs at their point of contact), is that just a visual glitch or is that something actually in the geometry?
I'll double check but I think it is visual. I couldn't be bothered to match x and y scaling last night.
 
Top Back Refresh